










Bitcoin Breaks Key Resistance Level: Technical Pattern Points to $76K Target
 ·
19.08.2026 18:48
·
2 min read
·
19.08.2026 18:48
·
2 min read

The price of the leading cryptocurrency has accelerated sharply, breaking through the $68,000 mark. According to technical analysis by CoinDesk, clearing the resistance zone on the chart opens up a calculated recovery target of around $76,000.
Bitcoin’s daily chart has completed a classic inverse head and shoulders pattern, which traditionally signals a trend reversal from bearish to bullish.
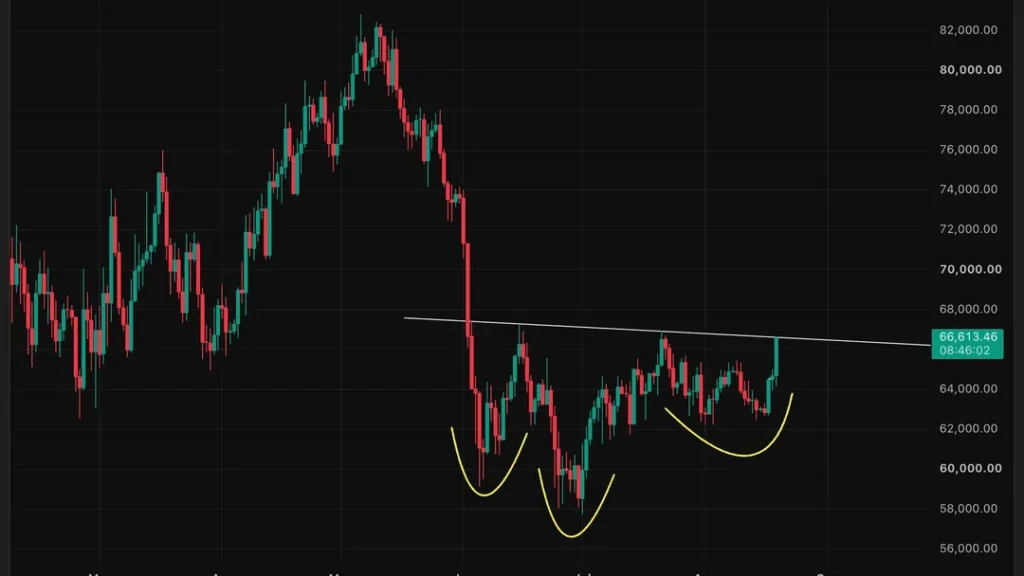
Chart Pattern and Upside Potential
The pattern has been forming on the chart since early summer: the left shoulder formed at $60,000, the local low (the head) hit $57,700, and the subsequent pullback to $62,500 completed the right shoulder.
The neckline, which served as the main resistance level, was in the $66,600–$66,800 range. Calculating the pattern’s height, the distance from the bottom to the neckline (about $9,000–$10,000) is projected upward from the breakout point, putting the potential price target at around $76,000. Analysts stress that the forecast holds only if the $66,600–$66,800 range holds as new support.
Macro Tailwinds and the CLARITY Act
The sharp price jump from an intraday level of $64,000 coincided with an improving macroeconomic backdrop in the US. The Treasury announced it would double the size of its bond buyback operations to $4 billion or more per operation, which pushed Treasury yields lower, weakened the dollar, and drove capital into risk assets.
Meanwhile, the market reacted to positive news from Washington: according to Investor’s Business Daily, a vote on the CLARITY Act, which would establish clear rules for digital asset regulation in the US, has been officially scheduled for September 15, 2026.
The current move remains part of a medium-term market recovery: Bitcoin is still trading well below its all-time high from October 2025, when the asset reached $126,000.